Power CRM through Data Mining
How 'Nearest Neighbor' can help in Prediction
One of the essential elements underlying the concept of clustering is that one particular object can be closer to another object of the same cluster. It is interesting that most people have an inherent sense of ordering placed on a variety of different objects. It is what allows us to build clusters - both in databases on computers as well as in our daily lives. This definition of nearness also allows us to make predictions.
The nearest neighbor prediction algorithm simply stated is:
Objects that are “near” to each other will have similar prediction values as well. Thus if you know the prediction value of one of the objects you can predict it for it’s nearest neighbors.
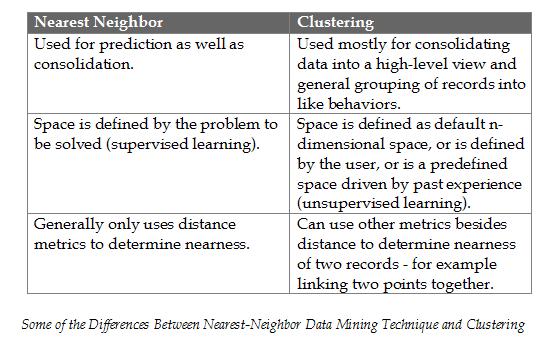
Difference between Clustering and Nearest Neighbor Technique:
The main distinction between clustering and the nearest neighbor technique is, clustering is an unsupervised learning technique and nearest neighbor is generally used for prediction or is a supervised learning technique. Unsupervised learning techniques are unsupervised in sense that when they are run there is no particular reason for the creation of the models the way there is for supervised learning techniques that are trying to perform prediction. In prediction, the patterns that are found in the database and presented in the model are always the most important patterns in the database for performing some particular prediction. In clustering there is no particular sense of why certain records are near to each other or why they all fall into the same cluster.
Source: From the book "Building Data Mining Applications for CRM"
by Alex Berson, Stephen Smith, and Kurt Thearling
Case Based reasoning:
Case Based reasoning methods try to simulate how a human being thinks. Typically, when an example is presented to a CBR solution it tries to match the current example with other examples that it has in its repository and retrieves the case that is most similar to the current case.
Visualization Techniques:
Visualization techniques allow the user to view data from various angles using graphic display techniques like charts, diagrams, display for multidimensional data etc. Used in conjunction with other data techniques, visualization techniques are ideal when users do not know what and where to look for to discover new knowledge.
Next Page
HOME|Page 1|Page 2|Page 3|Page 4|Page 5|Page 6|Page 8